INDICATORS
by Rudy Stefenel
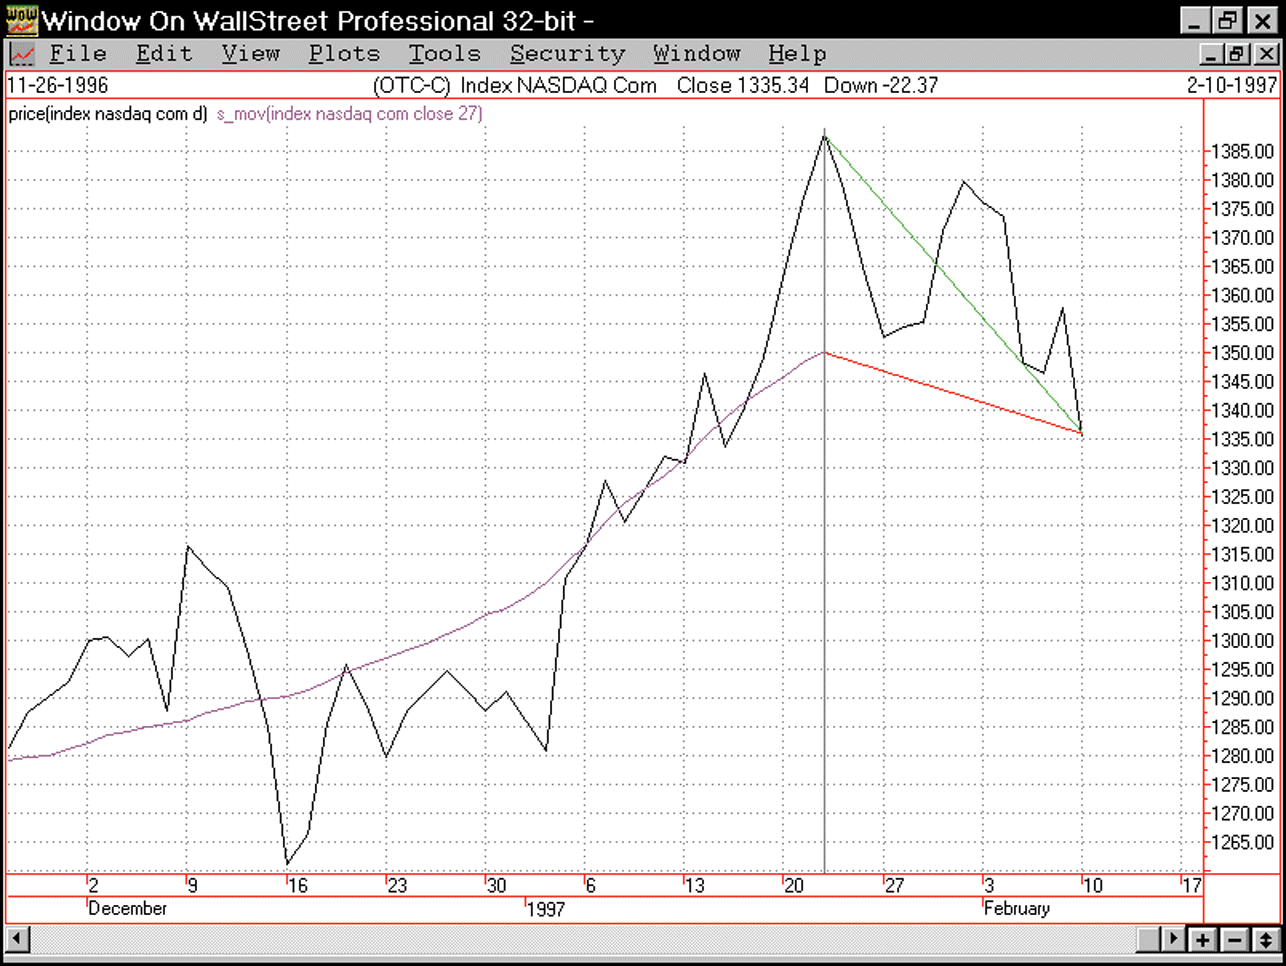
Two points on a security price plot can be used to calculate ordinary momentum. A straight line drawn between these points is the momentum line. Figure 1 shows a 27-day centered simple moving average (purple) for the NASDAQ composite index with two different 13-day momentum lines. The ordinary momentum line is green; the anchored momentum line is red. Both end at the closing price on the last day, which is the end of the price plot.
The ordinary momentum line begins where the composite index price was 13 days earlier, while the anchored momentum line begins where a centered simple moving average ends, which is 13 days earlier than the last day of the price plot. As you can see, anchored momentum is anchored to a centered simple moving average.
Think of the ends of these momentum lines riding along on the price plot as time passes. The left end of the anchored momentum line is clearly going to have a smoother ride in comparison to the left end of the ordinary momentum line.
ANCHORED MOMENTUM
Compared with the ordinary momentum indicator, the anchored momentum indicator has two important benefits:
1 An anchored momentum plot is about half as jagged as the ordinary momentum plot, and more important, the anchored momentum plot does not lag the ordinary momentum plot.
2 Anchored momentum represents the action of the security more faithfully than ordinary momentum does.

FIGURE 1: MOMENTUM. The ordinary momentum line begins where the composite index price was 13 days earlier, while the anchored momentum line begins where a centered simple moving average ends, which is 13 days earlier than the last day of the price plot. As you can see, anchored momentum is anchored to a centered simple moving average.
Think of the ends of these momentum lines riding along on the price plot as time passes. The left end of the anchored momentum line is clearly going to have a smoother ride in comparison to the left end of the ordinary momentum line.
Rudy Stefenel is a hardware engineering manager for Larscom Inc., a provider of global wide-area network access equipment for network service providers and large end-users. Most of his investing experience comes from FastTrack mutual fund data and software. He also uses several third-party support products that use FastTrack data to manage his investment. Stefenel can be reached via E-mail at rudy_s@pacbell.net.