February TRADERS' TIPS
Here is this month's selection of Traders' Tips, contributed by various developers of technical analysis software to help readers more easily implement some of the strategies presented in this issue.
You can copy these formulas and programs for easy use in your spreadsheet or analysis software. Simply "select" the desired text by highlighting as you would in any word processing program, then use your standard key command for copy or choose "copy" from the browser menu. The copied text can then be "pasted" into any open spreadsheet or other software by selecting an insertion point and executing a paste command. By toggling back and forth between an application window and the open Web page, data can be transferred with ease.
This month's tips include formulas and programs for:
 TRADESTATION
METASTOCK
TECHNIFILTER PLUS
SMARTRADER
WAVEWI$E MARKET SPREADSHEET
WINDOW ON WALLSTREET
or return to February Contents
 TRADESTATION
Last month, Tim Tillson provided a smoother way of using moving averages in his article "Smoothing techniques for more accurate signals." Here are two studies for use with TradeStation or SuperCharts that are based on the smoothing techniques discussed by Tillson. The indicators are called T3 and IE/2.
T3 plots a smoothed moving average line whose value falls anywhere between the double exponential moving average calculation (DEMA) and an exponential moving average (EMA). IE/2 plots a moving average that is derived from evenly splitting a combination of the integral of the linear regression slope (ILRS) and the endpoint moving average (EPMA). Both indicators include a basic alert criteria that is triggered when the close crosses above/below the smooth plotted value.
The basis of the calculation for the T3 indicator occurs in a function referred to as GD. This function handles the calculation known as generalized DEMA. The T3 indicator will handle the multiple smoothing of the generalized DEMA. As with any indicator that's based in part on a function, we must first begin by creating the function.
Type: Function
Name: GD
Inputs: Price(Numeric), Period(Numeric), vFactor(Numeric);
Vars: X1(0), X2(0), Dema1(0);
X1= XAverage(Price, Period) * (1 + vFactor);
X2= XAverage(XAverage(Price, Period), Period) * vFactor;
GD = X1 - X2;
Once the GD function has been created and verified in the Power Editor, the T3 indicator can then be created.
Type: Indicator
Name: T3
Inputs: Price(Close), Period(6), vFactor(.7);
Vars: T3(0);
T3 = GD (GD ( GD(Price, Period, vFactor), Period, vFactor), Period, vFactor);
Plot1(T3, "T3");
IF Close Crosses Above Plot1 OR Close Crosses Below Plot1 Then
Alert = True;
The scaling for the T3 indicator should be set to "Same as price data."
The second study is the IE/2 indicator. This entails a relatively simple calculation that utilizes several of TradeStation's built-in functions. Thus, all necessary calculations are contained within the indicator itself.
Type: Indicator
Name: IE/2
Inputs: Price(Close), Period(15);
Vars: ILRS(0), EPMA(0), IE(0);
ILRS = LinearRegSlope(Price, Period) + Average(Price, Period);
EPMA = LinearRegValue(Price, Period, 0);
IE = (ILRS + EPMA) / 2;
Plot1(IE, "IE/2");
IF Close Crosses Above Plot1 OR Close Crosses Below Plot1 Then
Alert = True;
The scaling for the IE/2 indicator should be set to "Same as price data."
This code is also available at Omega Research's Web site. The name of the file is "Smooth.ELA." Note that all Traders' Tips posted at Omega Research's Web site can be utilized by both TradeStation and SuperCharts. Whenever possible, the posted techniques include both the Quick Editor and Power Editor formats.
Gaston Sanchez, Omega Research
800 422-8587, 305 270-1095
Internet: https://www/omegaresearch.com
GO BACK
METASTOCK
The four indicators presented in Rudy Stefenel's article this month, "Anchored momentum," can be easily recreated in MetaStock. First, choose Indicator Builder from the Tools menu. If you have MetaStock 6.5, enter the following formulas:
General Anchored Momentum with Exponential Smoothing
MomPer := Input("Momentum Periods",1,1000,10);
SmaPer := Input("Simple Moving Average Periods",1,1000,7);
EmaPer := Input("Exponential Moving Average Periods",1,1000,7);
100 * ((Mov(CLOSE, EMAPer, E) / Ref(Mov(CLOSE, SmaPer, S), ((SmaPer - 1)/2) - MomPer)) - 1)
General Anchored Momentum
MomPer := Input("Momentum Periods",1,1000,10);
SmaPer := Input("Simple Moving Average Periods",1,1000,7);
100 * ((CLOSE / Ref(Mov(CLOSE, SmaPer, S), ((SmaPer - 1)/2) - MomPer)) - 1)
Most Anchored Momentum with Exponential Smoothing
MomPer := Input("Momentum Periods",1,1000,10);
SmaPer := Input("Simple Moving Average Periods",1,1000,7);
EmaPer := Input("Exponential Moving Average Periods",1,1000,7);
100 * ((Mov(CLOSE, EmaPer, E) / Mov(CLOSE, (2 * MomPer) + 1, S) ) - 1)
Most Anchored Momentum
MomPer := Input("Momentum Periods",1,1000,10);
SmaPer := Input("Moving Average Periods",1,1000,7);
100 * ((CLOSE / Mov(CLOSE, (2 * MomPer) + 1, S) ) - 1)
Drag any of the above indicators from the Indicator QuickList to the desired chart. MetaStock 6.5 will prompt you to enter values for the specified parameters. If you have an earlier version of MetaStock, you will need to enter values in the following formulas instead of using the MomPer, SmaPer and EmaPer variables.
General Anchored Momentum with Exponential Smoothing
100 * ((Mov(CLOSE, EMAPer, E) / Ref(Mov(CLOSE, SmaPer, S), ((SmaPer - 1)/2)- MomPer)) - 1)
General Anchored Momentum
100 * ((CLOSE / Ref(Mov(CLOSE, SmaPer, S), ((SmaPer - 1)/2) - MomPer)) -1)
Most Anchored Momentum with Exponential Smoothing
100 * ((Mov(CLOSE, EmaPer, E) / Mov(CLOSE, (2 * MomPer) + 1, S) ) - 1)
Most Anchored Momentum
100 * ((CLOSE / Mov(CLOSE, (2 * MomPer) + 1, S) ) - 1)
Allan J. McNichol, EQUIS International
800 882-3040, 801 265-8886
Internet: https://www.equis.com
GO BACK
TECHNIFILTER PLUS
Last month, in "Breaking out of price channels," Gerald Marisch presented a technique based on Tushar Chande's variable-length moving average (VIDYA). Marisch uses the VIDYA indicator to analyze price channels. Here's a TechniFilter Plus, version 8, formula for the VIDYA calculation.
Line 1 of the formula calculates the fixed part of the weight used in the exponential average. Line 2 is the sum of the up-day price changes, and line 3 is the absolute sum of the down-day price changes. Line 4 computes the momentum oscillator that provides the variable part of the weight used in the exponential average. Line 5 is a day count that is used in line 6 to decide whether there is sufficient prior data to calculate the average on any given day. Line 6 is the exponential calculation using a weight that's the product of the fixed weight and the variable weight, provided you are far enough along in the time series. Otherwise, it returns the close.
Once you have the VIDYA formula in your library, you can refer to it by name in other formulas to color your charts, as Marisch suggests in his article. To identify bars where the close is above the channel, use C>1.01*Vidya(21,5). To identify bars where the close is below the channel, use C<.99*Vidya(21,5). To identify bars where the close is in the channel, use:
(C>=.99*Vidya(21,5))&(C<=1.01*Vidya(21,5))
NAME: Vidya
SWITCHES: multiline recursive
PARAMETERS: 21,5
INITIAL VALUE: C
FORMULA: [1]: 2 / (&1+1) { weight }
[2]: (C-CY1)U4F&2 * (CU13>&2) { ups }
[3]: (CY1-C)U4F&2 * (CU13>&2) { downs }
[4]: ([2]-[3])U0 / ([2]+[3]) { abs_cmo }
[5]: CU13 { day count }
[6]: ([5]>&2) * ( [1]*[4]*C + (1-[1]*[4]) * TY1 ) + ([5]<=&2) * C
These and other TechniFilter Plus formulas may also be downloaded from RTR Software's Web site.
-- Clay Burch, RTR Software
919 510-0608, E-mail: rtrsoft@aol.com
Internet: https://www.rtrsoftware.com
GO BACK
SMARTRADER
Tushar Chande's variable-length moving average (VIDYA), used last month by Gerald Marisch in "Breaking out of price channels," is easily implemented in SMARTrader using a combination of preprogrammed math functions and user rows (Figure 1).
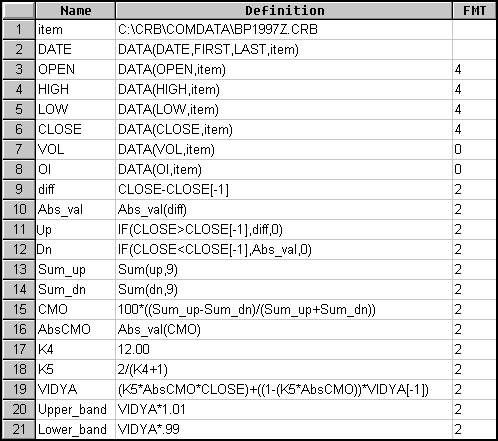
Figure 1: SMARTRADER. Here is the SmarTrader specsheet for implementing Tushar Chande's variable-length moving average (VIDYA).
Row 9 calculates the difference (diff) between the current day's close and the prior day's. Row 10 uses the absolute value (Abs_val) function to return a positive value, should the result of row 9 be a negative value.
Row 11 uses an if statement to test for an up day. If it's an up day, the value of diff is returned; otherwise, zero is returned. Row 12 checks for a down (Dn) day and returns Abs_val if true. Rows 13 and 14 sum the up and down days respectively for nine days. Row 15 calculates the CMO and row 16 takes the absolute value of CMO, should it be negative. Rows 17 and 18 represent cells K4 and K5 in the spreadsheet example.
Row 19 calculates the VIDYA and rows 20 and 21 generate the Upper_band and Lower_band, respectively.
This system can also be implemented in CompuTrac SNAP by eliminating the minus (-) sign from within the square brackets.
The SMARTrader specsheet file for this system can be downloaded from Stratagem Software's Web site.
Jim Ritter, Stratagem Software International
504 885-7353, E-mail: Stratagem1@aol.com
Internet: https://www.stratagem1.com
GO BACK
WAVEWI$E MARKET SPREADSHEET
The following WAVE WI$E formulas calculate Tushar Chande's variable-length moving average (VIDYA) used last month by Gerald Marisch in "Breaking out of price channels." The formulas also color the price chart using WAVE WI$E's Dynamic Color Bars.
A: DATE @TC2000(c:\tc2000\data,SP-500,STANDARD & POORS 500,DB)
B: HIGH
C: LOW
D: CLOSE
E: OPEN
F: VOL
G: Period 21
H: SumUp @IF(Close>Close[-1],Close-Close[-1],0); @ADD(SumUp,Period)
I: SumDn @IF(Close<Close[-1],Close[-1]-Close,0); @ADD(SumDn,Period)
J: absCMO @ABS((SumUp - SumDn)/(SumUp + SumDn))
K: ExSmooth 5
L: VIDYA @INIT(Period-1,Close);
VIDYA[-1] + absCMO * (2/(ExSmooth+1)) * (Close - VIDYA[-1])
M: Upper VIDYA*1.01
N: Lower VIDYA*.99
O: Colors @IF(CLOSE>UPPER,GREEN,
@IF(CLOSE<LOWER,RED,YELLOW))
P:
==========End Formulas
Peter Di Girolamo, Jerome Technology
908 369-7503, E-mail: jtiware@aol.com
Internet: https://members.aol.com/jtiware
GO BACK
WINDOW ON WALLSTREET
In last month's "Smoothing techniques for more accurate signals," Tim Tillson described two indicators derived from the concept of digital filter analysis. The generalized DEMA (GD) and its iterated version (T3) can easily be implemented in Window On WallStreet Day Trader and Window On WallStreet Professional Investor, 32-bit version.
In Window on WallStreet, begin with any open chart on your screen. Click the System Test button on the toolbar, click New and enter the following formula:
Generalized DEMA (or GD)
Name: Generalized DEMA
Description: Tim Tillson's GD from Technical Analysis of Stocks & Commodities, January 1998.
Variables:
Name: vol_mult
Prompt Text: Enter weighting factor between 0 and 1
Default Value: 0.7
Name: pers
Prompt Text: Enter number of periods for moving average
Default Value: 7
Formula(s):
(1+vol_mult)*mov(c,pers,e) - vol_mult*mov( mov(c,pers,e),pers,e)
T3 (or Iterated GD)
Name: T3
Description: Tim Tillson's T3 from Technical Analysis of Stocks & Commodities, January 1998.
Variables:
Name: vol_mult
Prompt Text: Enter weighting factor between 0 and 1
Default Value: 0.7
Name: pers
Prompt Text: Enter number of periods for moving average
Default Value: 7
Formula(2):
(1+vol_mult)*mov((1+vol_mult)*mov((1+vol_mult)*mov(c,pers,e) - vol_mult*mov(mov(c,pers,e),pers,e),pers,e) - vol_mult*mov( mov((1+vol_mult)*mov(c,pers,e)-vol_mult*mov(mov(c,pers,e),pers,e),pers,e),pers,e),pers,e) - vol_mult*mov(mov((1+vol_mult)*mov((1+vol_mult)*mov(c,pers,e) - vol_mult*mov(mov(c,pers,e),pers,e),pers,e) - vol_mult*mov( mov((1+vol_mult)*mov(c,pers,e)-vol_mult*mov(mov(c,pers,e),pers,e),pers,e),pers,e),pers,e),pers,e)
Andrew E. Laska, Window On WallStreet
888 732-5969, 972 783-6792
Internet: https://www.wallstreet.net
GO BACK
Return to February Contents


