Letters To The Editor
April 2010 Letters To The Editor
The editors of S&C invite readers to submit their opinions and information on subjects relating to technical analysis and this magazine. This column is our means of communication with our readers. Is there something you would like to know more (or less) about? Tell us about it. Without a source of new ideas and subjects coming from our readers, this magazine would not exist.
Address your correspondence to: Editor, Stocks & Commodities, 4757 California Ave. SW, Seattle, WA 98116-4499, or E-mail to editor@traders.com. All letters become the property of Technical Analysis, Inc. Letter-writers must include their full name and address for verification. Letters may be edited for length or clarity. The opinions expressed in this column do not necessarily represent those of the magazine. —Editor
SOFTWARE ISSUE
 Editor,
Can you tell me when your special issue comes out with the analyses on technical analysis software?
—Louis Witte
Netherlands
Our 2010 Bonus Issue, which includes the 2010 Readers’ Choice Awards for products and services voted most useful by our readers, was mailed to all current subscribers in late February. If you are not currently subscribing, you can contact our subscription department at Circ@Traders.com for a subscription or trial subscription. The issue is also available on some newsstands domestically in the US. The Bonus Issue also contains a software listing in the Traders’ Resource section. It is not a ranking or rating of software, but it is an extensive list of software used in our industry.
As for analyses of software, we publish in-depth reviews of software or websites related to technical analysis in every issue. —Editor
COMPUTRAC SOFTWARE?
 Editor,
I was wondering if you could help with this question. Back in 1994, Telerate sold the rights to the CompuTrac software to Stratagem Software. But Telerate retained the source code to the product. Stratagem renamed the product as Smartrader. Stratagem stopped operating back in 2006. I have been able to keep my copy (Smartrader) going, but now, with computer and Windows updates, it will no longer work. Can you help find the source code so that I can update my copy? I have had great joy working with this software, and with the source code, I would be able to continue my joy.
—David Coulter
Stratagem Software was the last software developer we knew of who was still supporting that software. We do not know of any sources for the actual source code. Perhaps someone reading this will know something or will write in with a suggestion.—Editor
DAYTRADE STRATEGIES
Editor,
I am very pleased to see the articles on the “how-to” daytrade strategies. Keep up these great articles.
—Garth Maynard
Lawrenceville, GA
OPTION-TRADING STRATEGIES
Editor,
I would like to see more articles in your magazine on the details of put/call strategies (such as spreads, covered calls, leaps, and so on) for option trading.
—Grant Sneed
SHOW THE MATH
Editor,
I have been reading Stocks & Commodities for about 30 years, for most of that time as a subscriber. For many years now I have been continually frustrated by your abandonment of detailed mathematical explanations in favor of code presentations. I think at one time you did use Excel for these presentations. In any event, many of your readers may be satisfied, but folks like me without the needed software are left out; it is just too expensive to obtain the software and learn the code to find out what the article is saying, whether it makes sense, and whether the technique tests out.
I have gotten to the point where the value of your magazine to me is marginal at best; I haven’t written before because I assume you know folks like me exist, but you have decided it is more profitable to present the mathematical explanations in some form of code currently in use rather than the math itself and/or rather than some explanation that would be generally helpful. But before I end our long association, I am moved to inquire why you follow this path, whether it is permanent, and whether I am missing some economically reasonable route to an understanding of your pieces.
—L. Grapentine
First, thank you for reading and subscribing to Stocks & Commodities for so many years. We appreciate your loyalty and value feedback from long-time subscribers.
This is a topic that has come up in our Letters To S&C column from time to time over the years. Some readers write in appreciation of the mathematical or statistical nature while many others complain of too much math and the level of difficulty.
However, code has been an integral part of this magazine from the start (with Basic being the most likely programming language you’d find in the early years). Since an important part of technical analysis is being able to test a technique, with computers aiding this endeavor, there has always been an interest among technicians in coding techniques for convenient implementation and the ability to test and backtest techniques on data sets. (The very first issue of this magazine featured three pages of Basic code to implement a fast Fourier transform, and a floppy disk containing the code was offered to users.)
You are correct that in the 1990s, you were more likely to find sidebars in articles with Excel spreadsheet implementations, given the advent of spreadsheet software at the time, the readability of its code, and its accessibility. But today, there is much more technical analysis software available than ever before, so most authors and readers are likely to be using one of these products instead. Some programs are low-cost. (See the Traders’ Resource area of our website, www.traders.com, for lists of technical analysis programs.)
If code is ever presented in the magazine for a program other than the one a reader is using, we suggest the reader contact the software developer of the program he or she is using to request equivalent code for that program. However, not all programs are customizable.
Different authors contributing to this magazine tend to rely on different products for implementing technical analysis techniques, ranging from Excel spreadsheets to software they’ve developed themselves to commercial software. We are happy to include Excel spreadsheet implementations when they are provided by the author. In the January 2010 issue, authors Etienne Botes and Douglas Siepman included a sidebar presenting an Excel implementation of their Vortex Indicator. We’ve always felt this can be a useful way to express the logic behind a technique in a platform that is readily available.
We try to include explanations in English when possible, since part of the mission of this magazine is to be how-to in nature.
Since 1995, we have included a Traders’ Tips section in the magazine to have a way to try to offer code for different platforms instead of just the one an author may be using. Some readers peruse these sets of code just to get a feel for the logic behind the technique presented; that is one reason we print the code instead of just making it available for download at our website.
We regret you are disappointed in the amount of math shown, although just taking some recent examples, pure mathematical explanations or expressions were provided in articles including “Short-Term Profits With Gap Trading” (November 2009); “Do You Need Volume To Move Stocks Higher?” (November 2009); “Making The Most Of A Trend With The Disparity Index” (December 2009); “What’s Your Trading Price?” (January 2010); “Predicting Market Data Using The Kalman Filter” (January 2010); “Predicting Market Data Using The Kalman Filter, Part 2” (February 2010); “Unraveling The Mystery Of Stock Prices” (March 2010); “The McGinley Dynamic” (March 2010); “Trading Tradeoffs With Risk Vs. Reward” (Bonus Issue 2010); and “Signal Processing Basics” in this issue. —Editor
LESS COMPLEX ARTICLES
Editor,
I’ve been reading Stocks & Commodities since the 1990s. I would request more articles on simple, non-complex techniques.
—Richard Goldblatt
Thank you also for reading Stocks & Commodities for so long. We appreciate feedback from all our readers. We try to include articles for every level of trader in each issue, and we regret if that goal isn’t always obtained. —Editor
VORTEX INDICATOR IN TRADING BLOX
 Editor,
I noted with interest the article in your January 2010 issue on the Vortex Indicator and its being featured in your Traders’ Tips section in the same issue. The concept is interesting and I decided to research it further for myself.
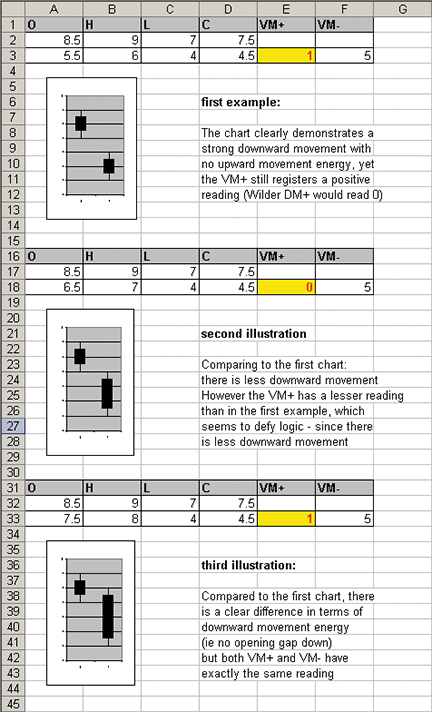
I believe that there might be a conceptual problem with the indicator in the way that it handles gaps (by taking absolute values). I am attaching a diagram to illustrate my point (Figure 1). I have also developed what I think is an improved version of the indicator using correct handling of gaps and a moving average (available here: https://www.automated-trading-system.com/free-code-improved-vortex/).
I have discussed this with the authors of the article, Etienne Botes and Douglas Siepman, and they have indicated that the design of the indicator was intended as written and that the use of the indicator in the forex markets does not expose them to gaps.
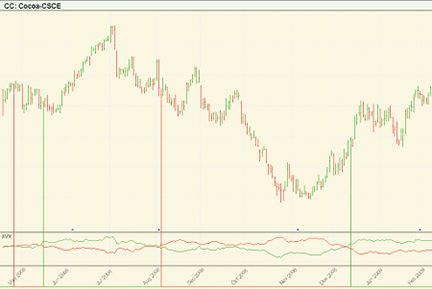
By the way, I noticed that code implementing the indicator and associated system in the program Trading Blox was not provided in your Traders’ Tips section. Since Trading Blox is the backtesting software I use, I coded the indicator for this software. (See a sample chart in Figure 2.) I thought you might be interested in sharing it with your readers, so I am including snippets of code. (I can also provide the actual .tbx files.) I maintain a blog and I posted an article about the indicator there: https://www.automated-trading-system.com/vortex-indicator/. The .tbx files can be downloaded from there too. (Please note that I am not associated with Trading Blox; I am just one of their users.)
—Jez Liberty

FIGURE 1: VORTEX INDICATOR

FIGURE 2: VORTEX INDICATOR IN TRADING BLOX
(AUXILIARY BLOX):

TR calculated indicator formula:
Max(instrument.High-instrument.Low,Abs(instrument.High-instrument.
Close[1]), Abs(instrument.Low-instrument.Close[1])):

minusVM calculated indicator formula:
Abs(instrument.High[1]-instrument.Low)

plusVM calculated indicator formula:
Abs(instrument.High - instrument.Low[1])

List of instrument permanent variables (all of type series):
minusVI (scope: System)
plusVI (scope: System)
TRSum
minusVMSum
plusVMSum

Parameter:
viDays (integer)

Update Indicators script:
plusVMSum=Sum(plusVM,viDays,0)
minusVMSum=Sum(minusVM,viDays,0)
TRSum=Sum(TR,viDays,0)
plusVI=plusVMSum/TRSum
minusVI=minusVMSum/TRSum

CODE FOR SAMPLE SYSTEM:

Exit Orders:
� Enter stop if "Use ATR Stops" is true
� ---------------------------------------------
IF useATRStops THEN
broker.ExitAllUnitsOnStop( instrument.unitExitStop )

ENDIF

Entry Orders:
VARIABLES: pvi TYPE: Floating
pvi = plusVI
VARIABLES: nvi TYPE: Floating
nvi = minusVI����
VARIABLES: pos TYPE: String
pos = instrument.position

IF      plusVI > minusVI AND
         instrument.position <> LONG THEN

         IF useATRStops THEN
                broker.EnterLongOnOpen( instrument.close - averageTrueRange * atrStop )
         ELSE
                broker.EnterLongOnOpen
         ENDIF

ENDIF

IF      plusVI < minusVI AND
         instrument.position <> SHORT THEN

         IF useATRStops THEN
                broker.EnterShortOnOpen( instrument.close + averageTrueRange * atrStop )
         ELSE
                broker.EnterShortOnOpen
         ENDIF

ENDIF
 —Jez Liberty
See also Jez Liberty’s contribution to the Traders’ Tips section in this issue for coding David Hawkins’ modified volume-price trend indicator in Microsoft Excel. —Editor